Cost and affordability of health care are understandably at the forefront of consumer concerns as studies show rising health care spending across the nation. SHADAC’s work on these subjects ranges from studies involving primary data collection to assess costs of care, such as care coordination costs; to secondary data analyses of individuals who forgo needed medical care or make changes to prescription drugs due to cost; and of increasing premiums and deductibles in our annual employer-sponsored insurance report. SHADAC staff have also modeled the projected use and cost of Medicaid spending on long-term services and supports for Medicaid enrollees.
Blog & News
Hest, Robert
Lanigan, Lindsey


Exploring Cost and Coverage Rates in Employer-Sponsored Insurance (Infographic)
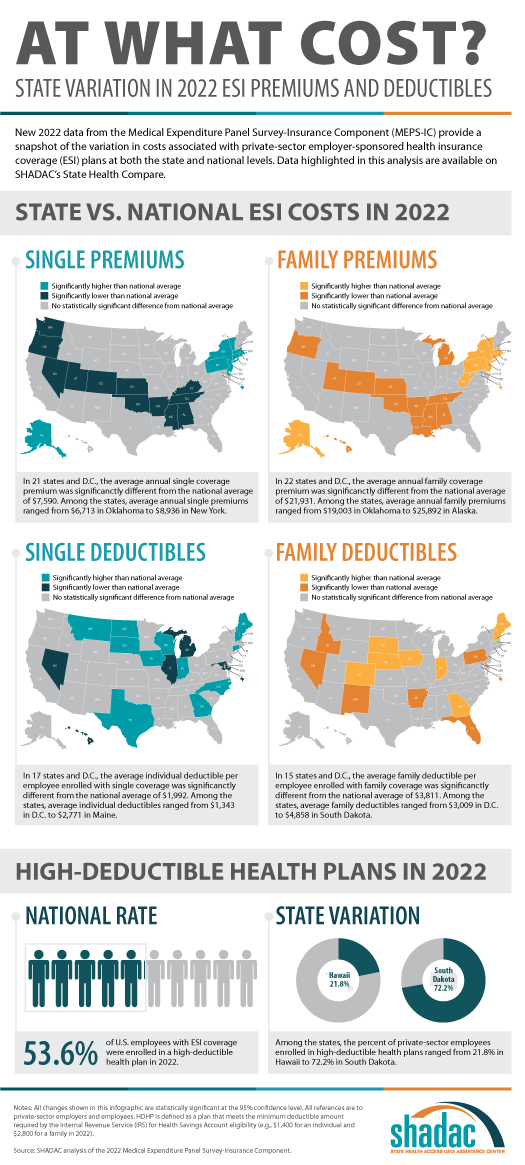
September 5, 2023:Throughout the United States, a majority of Americans and their families receive health insurance coverage through their employer. In 2021, the number of people covered by this type of coverage—known as employer-sponsored insurance or ESI—exceeded 169 million. While a fuller picture of the coverage landscape will be available later this fall as agencies such the U.S. Census Bureau release more health insurance data, in this blog and infographic, SHADAC researchers use recently released data from the Medical Expenditure Panel Survey-Insurance Component (MEPS-IC) to analyze private-sector ESI and provide an initial snapshot of estimates for 2022 on a national level and within the states.
Key Findings (2022 vs. 2021)
 Employee Access to Coverage
- The offer of employer-sponsored insurance coverage was extended to a large majority of private-sector workers. In 2022, 85.6% of employees in the U.S. worked in establishments that offered health insurance coverage, a rate that was statistically unchanged from 2021 (85.7%).
Employee Coverage Costs
Premiums
- The average annual premium for single coverage significantly increased to $7,590 in 2022, a $210 or 2.8% increase from 2021.
- Among the states, average annual single premiums ranged from $6,713 in Oklahoma to $8,936 in New York.
- For those enrolled in family coverage, average annual premiums also significantly increased. In this case, premiums increased to $21,931 in 2022, a $550 or 2.6% increase from 2021.
- Among the states, average annual family premiums ranged from $19,003 in Oklahoma to $25,892 in Alaska.
Deductibles
- For single coverage, the 2022 average individual deductible was $1,992, unchanged from 2021 ($2,004).
- Among the states, average individual deductibles ranged from $1,343 in D.C. to $2,771 in Maine.
- Among those enrolled in family coverage, the average deductible per employee enrolled was $3,811 in 2022. This was also unchanged from 2021 ($3,868).
- Among the states, average family deductibles ranged from $3,009 in D.C. to $4,858 in South Dakota.
High-Deductible Health Plans*
- In 2022, the share of employees enrolled in high-deductible health plans (HDHPs) decreased significantly in 2022 to 53.6% – a decrease of 2.1 percentage points from 2021.
- Among the states, the percent of private-sector employees enrolled in high-deductible health plans ranged from 21.8% in Hawaii to to 72.2% in South Dakota.
Key Takeaways
With so many Americans relying on an employer for health insurance coverage, measures of ESI coverage and cost remain important indicators of the financial and health burdens many individuals and families face. These measures will be of greater importance going forward as some current Medicaid enrollees may transition to employer coverage during the 2023-2024 unwinding of the Medicaid continuous coverage requirement. SHADAC is monitoring the unwinding process through a variety of avenues, including: federal surveys, state dashboards, and state-based marketplace data.
In 2022, as in previous years, premiums continued to rise, though premium increases were small compared to the relatively high rate of inflation in 2022. Average deductibles were unchanged from 2021, which represents a break from the long-running trend of increasing deductibles. Additionally, the share of private sector employees enrolled in high-deductible plans decreased by a small but statistically significant margin, which represented the first decrease since 2013. With regard to coverage, a large majority of workers were employed in establishments that offered health insurance coverage, and this was unchanged from 2021.
Notes and Sources
* High-deductible health plans (HDHP) are defined as plans that meet the minimum deductible amount required for Health Savings Account (HSA) eligibility ($1,400 for an individual and $2,800 for a family in 2022).
Data are from the 2022 Medical Expenditure Panel Survey–Insurance Component (MEPS-IC), produced by the Agency for Healthcare Research and Quality (AHRQ).
Health insurance coverage estimates through 2021 are available on SHADAC’s State Health Compare web tool at statehealthcompare.shadac.org, and estimates for 2022 will be added soon.
Blog & News

Analyzing Forgone Care by Coverage Type: New on State Health Compare
June 29, 2023:For most Americans, having health insurance is an important first step to being able to access and afford health care when it is needed.
As shown in recent data published on SHADAC’s State Health Compare, adults with health insurance coverage were at least 79% less likely to report having forgone (gone without) medical care when they needed it because of cost than adults without health insurance coverage. Whereas 63 percent of adults without health coverage reported forgone care, no more than 14 percent of those with coverage reported forgone care. This statistic illustrates the ability of health insurance coverage to protect against unexpected health care costs.
However, these data indicate that health insurance coverage’s ability to protect against unexpected health care costs varies by state and by type of health insurance coverage. The chart below shows the percent of adults (age 18+) who could not get medical care when needed due to cost by state and source of health insurance coverage. In the U.S., adults with some types of coverage such as Medicare (5 percent) or employer/military coverage (6 percent) were less likely to have gone without care because of cost compared with other types of coverage, such as individual coverage (10 percent) or Medicaid/CHIP coverage (14 percent).
It is important to note that the size of these differences in the protective power of health insurance coverage varied substantially by state. For example, where 11 percent of Georgia adults with employer coverage went without care, just 3 percent of employer-covered adults in the District of Columbia went without care. And similar state differences existed for other types of coverage:
- For adults with Medicare coverage, 9 percent of Louisianans had forgone care versus 3 percent of Vermonters.
- For adults with individual coverage, 16 percent of Nevadans had forgone care versus 3 percent of Vermonters.
- For adults with Medicaid/CHIP coverage, 25 percent of Oklahomans had forgone care versus 7 percent of South Dakotans.
- For adults with no health insurance coverage, 77 percent of Nevadans had forgone care versus 44 percent of South Dakotans.
These state differences highlight the inconsistency in the quality of health insurance coverage across the U.S., often related to differences in states’ markets for private health insurance coverage (e.g., individual coverage or employer coverage), differences in state Medicaid and CHIP programs, and differences in health care costs across the states.
Differences by coverage type call attention to variation in the ability of different types of health insurance coverage to protect covered adults from the risks of expensive or unexpected health care needs. However, these differences also highlight disparities in the underlying economic and health vulnerabilities of adults covered by different types of coverage.
Accessing BRFSS Coverage Data on State Health Compare
The data presented here come from SHADAC analysis of the 2021 Behavioral Risk Factor Surveillance System (BRFSS), a survey conducted in partnership between states and the Centers for Disease Control, and are available on SHADAC’s State Health Compare web tool.
Data on detailed health insurance coverage types were collected among all participating states in the BRFSS for the first time in 2021. These new data have allowed State Health Compare to include breakdowns by detailed coverage type for all eight BRFSS measures that feature 2021 data and are the first source of information about these important measures of access and affordability of care, outcomes, and health behaviors for adults with specific types of coverage (e.g., Medicaid/CHIP).
BRFSS measures to explore further:
Notes: All differences described in this analysis are statistically significant at the 95% confidence level. Estimates are representative of the civilian non-institutionalized population 18 years and over and are based on SHADAC analysis of the 2021 Behavioral Risk Factor Surveillance System public use files. Florida data are not available in 2021 because the state was unable to collect sufficient data, and 2021 national data do not include Florida. Other state-level data were not available due to suppression where the number of sample cases was too small.
Blog & News

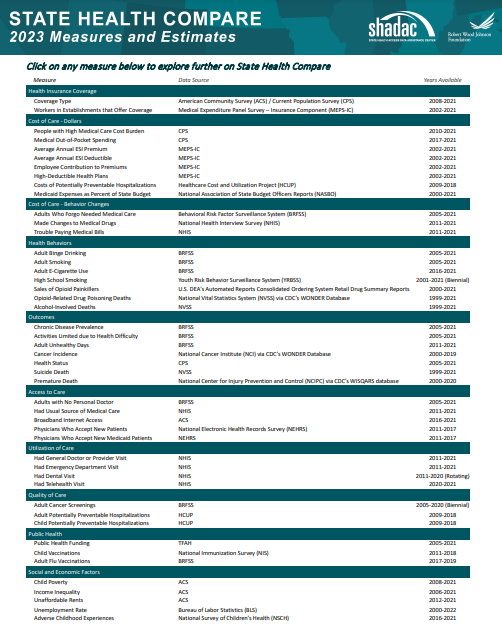
Now Available on State Health Compare: One Brand New Measure and Five Updated Measures
May 26, 2023:Estimates for five measures of health care access, affordability, and use have now been updated on SHADAC’s State Health Compare. One new measure, Had Telehealth Visit, has also been added to State Health Compare. The new and updated measures are all produced using data from the National Health Interview Survey (NHIS), conducted by the National Center for Health Statistics (NCHS). SHADAC produces these state-level measures using restricted-access data through the Minnesota Research Data Center (MnRDC). SHADAC’s State Health Compare is the only source of state-specific data for these measures which are essential for monitoring individuals’ access to and use of medical care, along with their ability to afford care.
These measures now contain data through 2021, using two-year pooled periods (i.e., 2019-2020, 2020-2021). The measures can be broken down by Total, Age, and Coverage Type (Public, Private, Uninsured).
Updated and new measures include:

 NEW: Had Telehealth Visit
This measure describes the percent of individuals who had a medical appointment by video or phone during the past twelve months.

 Had Usual Source of Medical Care
This measure captures rates of individuals who had a usual place of medical care other than an emergency department during the past twelve months.
 Had General Doctor or Provider Visit
This measure provides rates of individuals who had any visit to a general doctor or provider within the last year.
 Had Emergency Department Visit
This measure looks at rates of individuals who had any type of visit to an emergency department in the past twelve months.
 Trouble Paying Medical Bills
This measure examines rates of individuals who had trouble paying off medical bills during past twelve months.
 Made Changes to Medical Drugs
This measure highlights rates of individuals who were prescribed medication in the past twelve months who made changes to their medical drugs due to cost during the past twelve months. This includes delaying filling a prescription, taking less medicine, or skipping doses to save money.
Click here to explore these measures on State Health Compare!
Notes: Data for State Health Compare’s Had Dental Visit measure is only asked in the NHIS rotating core and thus was not asked in the 2021 survey. We will be able to update that measure with new data after both the 2022 and 2023 data are out in mid-2024.
All measures are representative of the civilian noninstitutionalized population.
Data Source: The estimates were produced using restricted NHIS data in the MnRDC. Measures have been updated with data through 2021 using two-year pooled periods, including (a) 2011–2012 through 2017–2018 and (b) 2019-2020 through 2020-2021, except in the case of the telehealth measure for which data is only available from 2020-2021.
Blog & News

SHADAC in JHPPL: The Future of State All-Payer Claims Databases
January 24, 2023:This journal article was originally published in Volume 48, Issue 1 of the Journal of Health Politics, Policy and Law (JHPPL).
Authors: Lynn A. Blewett, PhD, MPA, Natalie Schwehr Mac Arthur, PhD, MAc, and James Campbell
SHADAC researchers recently published an article in the Journal of Health Politics, Policy and Law on states’ development and use of state-based all-payer claims databases (APCDs).
Abstract
State policymakers are under increasing pressure to address the prohibitive cost of health care given the lack of action at the federal level. In 2020, the United States spent more on health care than any other country in the world—$4.1 trillion, representing 19.7% of the nation's gross domestic product. States are trying to better understand their role in health care spending and to think creatively about strategies for addressing health care cost growth. One way they are doing this is through the development and use of state-based all-payer claims databases (APCDs). APCDs are health data organizations that hold transactional information from public (Medicare and Medicaid) and private health insurers (commercial plans and some self-insured employers). APCDs transform this data into useful information on health care costs and trends. This article describes states' use of APCDs and recent efforts that have provided benefits and challenges for states interested in this unique opportunity to inform health policy. Although challenges exist, there is new funding for state APCD improvements in the No Surprises Act, and potential new federal interest will help states enhance their APCD capacity so they can better understand their markets, educate consumers, and create actionable market information.
Read the full research article in Volume 48, Issue 1 of the Journal of Health Politics, Policy and Law.
Blog & News
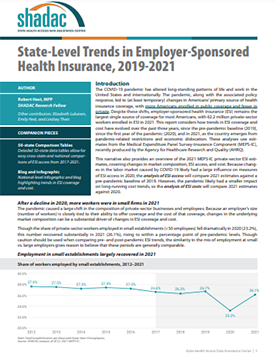
Employer-Sponsored Insurance (2019-2021): A National-Level Look at Cost and Coverage Rates (Infographic)
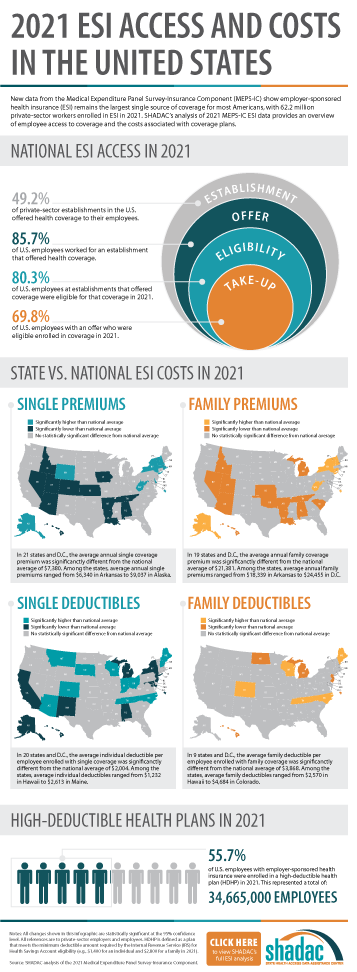
August 30, 2022:Throughout the United States, a majority of Americans and their families receive health insurance coverage through their employer. In 2021, the number of individuals enrolled in this type of coverage–known as employer-sponsored insurance or ESI–exceeded 62.2 million. In this blog, infographic, and companion documents, SHADAC researchers use data from the Medical Expenditure Panel Survey-Insurance Component (MEPS-IC) to analyze the private-sector ESI landscape in 2021 on a national level and within the states. As discussed in SHADAC’s 2020 ESI coverage blog, the COVID-19 pandemic complicated the collection and analysis of data throughout recent years, leading our researchers to compare 2021 ESI access data against pre-pandemic (2019) estimates and 2021 ESI cost data against 2020 estimates.
Key Findings
Employee Access to Coverage (2019 vs. 2021)
Establishment
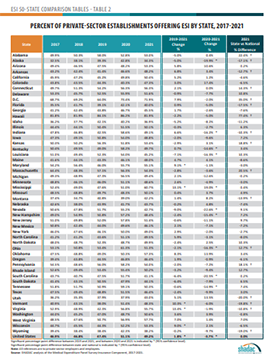
Not all private sector establishments offer their employees health insurance coverage. In fact, slightly less than half of establishments in the U.S. offered coverage in 2021 (49.2%). This was a significant increase from 47.4% in 2019.
Offer
The offer of employer-sponsored insurance coverage was extended to the majority of private-sector employees. In 2021, 85.7% of employees in the U.S. worked in establishments that offered health insurance coverage, a rate that remained statistically unchanged from 2019 (85.3%).
Eligibility
Among employees working at establishments that offered coverage, the percent eligible for coverage was 80.3% in 2021; an increase from 77.7% in 2019.
Take-Up
The take-up rate of ESI-eligible employees has varied over the years, and in 2021, 69.8% of eligible employees enrolled in coverage. This represented a 2.1 percentage-point decrease from 2019 (71.9%).
Employee Coverage Costs (2020 vs. 2021)
Premiums and contributions
- The average annual premium for single coverage rose to $7,380 in 2021, a $231 or 3.2% increase from 2020.
- For those enrolled in family coverage, average annual premiums also rose. In this case, premiums climbed to $21,381 in 2021, a $623 or 3.0% increase from 2020.
Deductibles
- For single coverage, the 2021 average individual deductible was $2,004. This represented a significant increase of 3.0% from 2020 ($1,945).
- Among those enrolled in family coverage, the average deductible per employee enrolled was $3,868 in 2021. This was also a significant increase of 3.9% from 2020 ($3,722).
High-Deductible Health Plans
- In 2021, the share of employees enrolled in high-deductible health plans (HDHPs) increased substantially in 2021 to 55.7% – an increase of 5.3 percentage points from 2020.
Key Takeaways
With so many Americans relying on their employers for health insurance coverage, ESI findings remain an important indicator of the financial and health burdens many individuals and families face. In 2021, the U.S. experienced several continuing ESI trends, including rising costs across employee premiums, premium contributions, and deductibles. Additionally, the share of private sector employees enrolled in high-deductible plans increased substantially. In regards to coverage, more employers offered ESI to their employees in 2021 when compared to pre-pandemic levels. Meanwhile, the rate of ESI-eligible employees enrolling in offered coverage was down overall from pre-pandemic, though unchanged from 2020.
For more detailed information on ESI findings from SHADAC, see the following products:
 Report Narrative
The report narrative provides an in-depth look at 2019-2021 ESI estimates including state-level changes and trends.
50-State Comparison Tables
The 50-state tables include 2017-2021 ESI estimates and allow for easy cross-state and state vs. national analysis.
Other related resources
• 2021 ESI Blog (2019-2020 data)
• 2020 ESI Report, Blog, and Infographic (2015-2019 data)
• 2019 ESI Report, Blog, and Infographic (2014-2018 data)