A new analysis from SHADAC highlights the experiences of private sector workers with employer-sponsored insurance (ESI) from 2012 through 2016 at the national level and in the states.
Key Findings
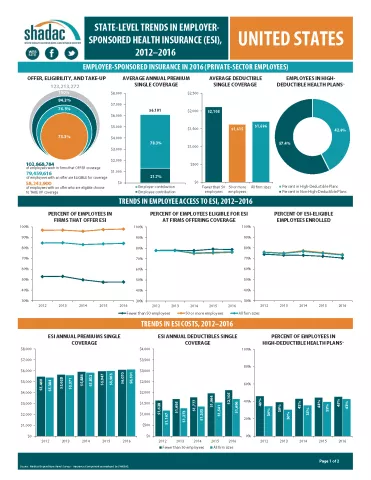
- Nationally, the percentage of employers offering health insurance coverage was unchanged from 2015 to 2016, as was the percentage of workers eligible for ESI offered to them.
- Changes in offer rates from 2015 to 2016 varied by firm size: Offer rates stabilized among small firms but increased among large firms.
- Nationally, 73.3 percent of eligible workers were enrolled in ESI in 2016, down 1.7 percentage points (pp) from 2015.
- Premium increases have continued, but the growth rate of premiums remained stable from 2015 to 2016.
- Slowed premium growth from 2015 to 2016 was offset by a 10.1 percent ($155) increase in average deductibles during this time period.
- The proportion of workers enrolled in high-deductible health plans nationwide grew significantly from 2015 to 2016, reaching 42.6 percent (a 3.2pp increase).
- State variation in access to and enrollment in ESI plans, along with ESI cost, continued.
The Takeaway
Employer-sponsored insurance continues to be the backbone of the insurance coverage system in the United States, covering more than half the population, but we are seeing a decline in the financial protection provided by employer coverage.
SHADAC Deputy Director Elizabeth Lukanen noted, “SHADAC’s analysis shows that while the number of workers with employer-sponsored coverage isn’t changing much over time, the value of their coverage is eroding, as employees shoulder increasingly higher deductibles.”
And, with the dominant role of employer coverage in the broader coverage landscape, it’s important to note that even small changes in the value of employer coverage affect a significant number of people.
Explore the Analysis
The following products present findings from this analysis:
- Summary chartbook highlighting key findings on levels of, and trends in, employee access to and take up of ESI coverage as well as average ESI premiums and deductibles
- Two-page profiles of ESI for each state
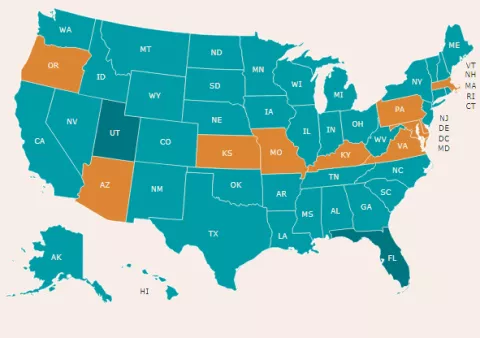
- 50-state interactive map showing levels of, and changes in, worker enrollment in high-deductible health plans in 2016, with links to state profile pages
- 50-state comparison tables
About the Data
This analysis uses data from the Medical Expenditure Panel Survey-Insurance Component (MEPS-IC).


