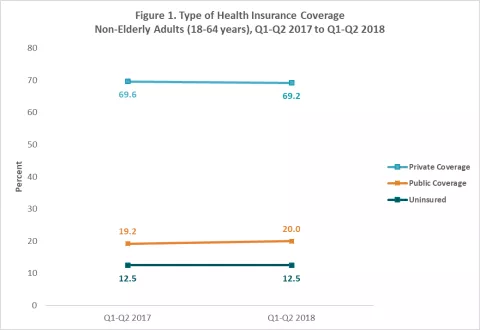
Nationwide, 12.5% of nonelderly adults (ages 18-64) were uninsured in the first half of 2018, unchanged from 12.5% in the same period in 2017.
This finding is based on new health insurance coverage estimates for Q1-Q2 2018 from the National Health Interview Survey (NHIS). These estimates were released by the National Center for Health Statistics (NCHS) as part of the NHIS Early Release Program and are the first available half-year coverage estimates for 2018 from a federal survey.
Uninsurance and Public and Private Coverage Rates Remained Stable for Nearly All Groups in 2018
The new NHIS estimates show that uninsurance rates, as well as rates of public and private coverage, were statistically unchanged across age, race/ethnicity, and income groups between the first half of 2017 and the first half of 2018. Figure 1 shows levels of health insurance coverage by type among non-elderly adults overall across this time period.
Changes in Coverage Type among Some Subgroups
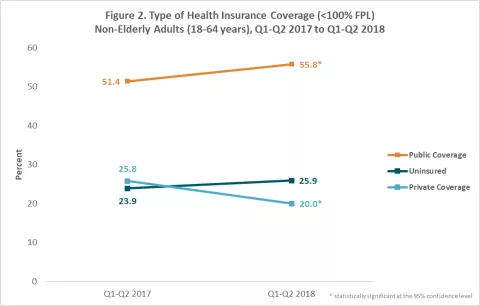
The rate of public coverage among non-elderly adults with incomes below 100% of the federal poverty level (FPL) increased to 55.8% in the first half of 2018 from 51.4% in the first half of 2017, while the rate of private coverage among this group decreased to 20.0% in the first half of 2018 from 25.8% in the first half of 2017 (Figure 2). The rate of uninsurance among this group remained statistically unchanged over the same period.
The rate of public coverage also increased among all non-elderly persons (age 0–64) with incomes at or above 200% FPL, growing to 12.2% in the first half of 2018 from 11.2% in the first half of 2017. Non-elderly adults (age 18-64) with the same level of income also experienced an increase in public coverage over the same period, though this change was only significant at the 90% confidence level. Neither age group in this income range saw a significant change in private coverage or uninsurance from the first half of 2017 to the first half of 2018.
About the Numbers
The above estimates provide a point-in-time measure of health insurance coverage, indicating the percent of persons with that type of coverage at the time of the interview. The 2018 estimates are for the months of January to June 2018 and are based on a sample of 39,112 persons from the civilian noninstitutionalized population.
Differences described in this post are statistically significant at the 95% confidence level unless otherwise specified.
For more information about the early 2018 NHIS health insurance coverage estimates, read the National Center for Health Statistics brief.
Citation
Martinez, ME., Zammitti, EP., & Cohen, RA. November 15, 2018. “Health Insurance Coverage: Early Release Estimates from the National Health Interview Survey, January–June 2018.” National Center for Health Statistics: National Health Interview Survey Early Release Program. Available at https://www.cdc.gov/nchs/data/nhis/earlyrelease/Insur201811.pdf.


