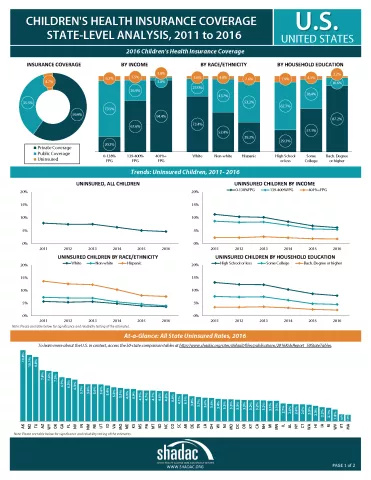
A new analysis from SHADAC examines health insurance coverage among children in the United States from 2013 through 2016, looking at changes in children’s coverage before and after the coverage provisions of the Affordable Care Act (ACA) took effect in 2014. The report examines coverage at both the national and state level, among children as a whole and by income, race/ethnicity, and educational attainment.
Key Findings
- Children in the United States have seen significant declines in uninsurance since the coverage provisions of the ACA took effect, with the number of uninsured children dropping by 2.2 million, or 2.9 percentage points (pp), between 2013 and 2016. These coverage gains were sustained despite an uncertain policy climate around the ACA.
- Recent reductions in the rate of uninsurance among children were driven by increases in both public and private coverage from 2013 to 2016, although public coverage increases were greater than increases in private coverage, at 1.8 pp and 1.1 pp, respectively.
- Drops in uninsurance were seen across demographic categories, and some of the largest coverage gains continued to be made by groups of children that have historically had the highest rates of uninsurance: low-income, Hispanic, and non-white children and children in households with low educational attainment. Despite coverage gains, coverage rates for these groups are still significantly below those of high-income children and white children, and coverage varies across states.
"The decline in the number of uninsured children after the enactment of the ACA is historic and persistent," noted report author Elizabeth Lukanen. "It is especially encouraging to see uninsurance rates drop in almost all states and across children of different demographic and income groups. Given the uncertain health policy environment, ongoing monitoring of children’s uninsurance will be necessary to ensure that reductions in uninsurance are sustained."
Explore the Analysis
The following products present findings from this analysis:
- Summary chartbook highlighting key findings on coverage among children from 2013 to 2016 at the national and state level and by income, race/ethnicity, and educational attainment
- Two-page profiles of children’s coverage for each state
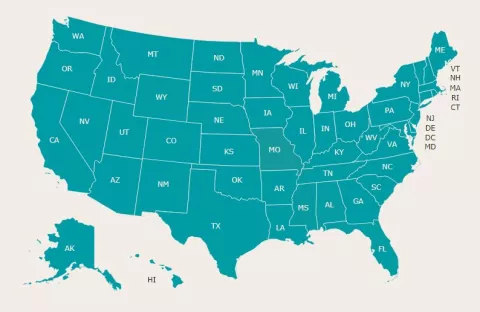
- 50-state map linking to individual state profile pages
- 50-state comparison tables
About the Data
This analysis uses data from the American Community Survey (ACS).


